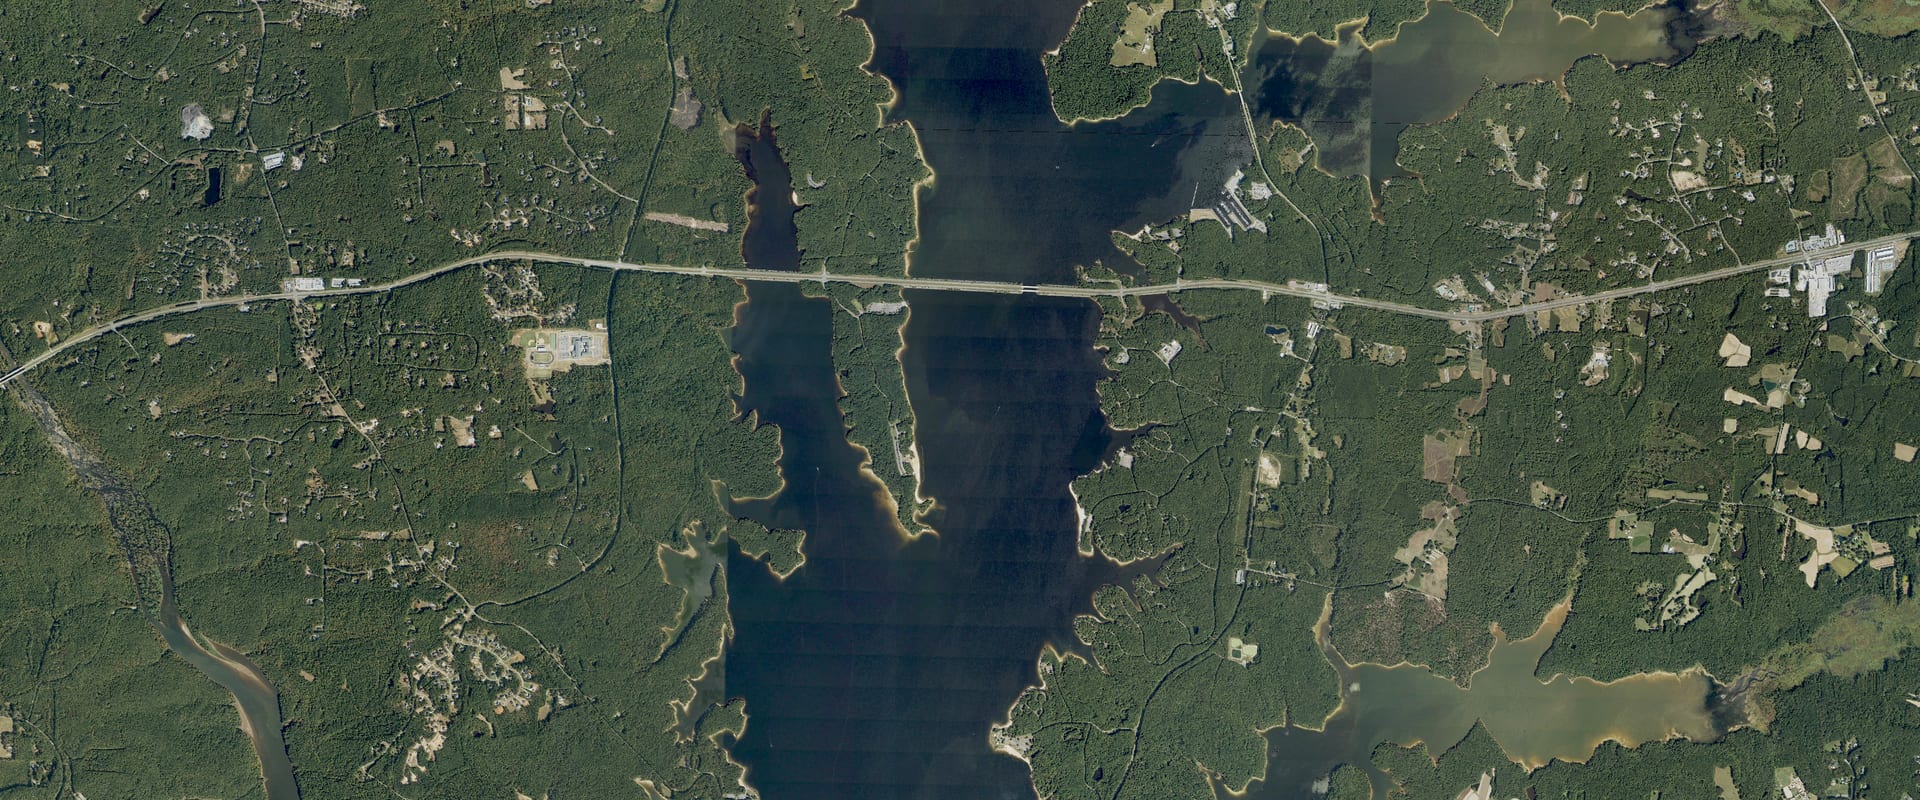
Jordan Lake Water Level Today
3.0 ft below full pool, 72.0% full, and 1.0 ft lower than a year ago.
Read Oct 26, 3:00 PM EDT
Trend and source week, month, year
Source: U.S. Army Corps of Engineers. Check it at waterdata.usgs.gov/monitoring-location/02098197/
Which Jordan Lake ramps work at 213.0 ft
13 of 13 ramps are usable at today's level, 0 marginal and 0 out of the water. This is our own comparison of today's level with each ramp's pool range in the Corps' data; the Corps doesn't publish an official minimum pool, so treat it as a guide and check with the park.
- Cross Winds Marina Usable
4 lanes · works with the lake between 202 and 0 ft
- Crosswinds Campgrounds Usable
2 lanes · works with the lake between 207 and 0 ft
- Ebenezer Church Usable
6 lanes · works with the lake between 202 and 0 ft
- Farrington Point Usable
4 lanes · works with the lake between 202 and 0 ft
- Farrington Point Hand Carried Usable
2 lanes · works with the lake between 208 and 0 ft
- New Hope Overlook Usable
6 lanes · works with the lake between 202 and 0 ft
- Parkers Creek Usable
2 lanes · works with the lake between 210 and 0 ft
- Poe's Ridge Usable
4 lanes · works with the lake between 210 and 0 ft
- Poplar Point Usable
4 lanes · works with the lake between 210 and 0 ft
- Robeson Creek Usable
2 lanes · works with the lake between 202 and 0 ft
- Seaforth Usable
6 lanes · works with the lake between 205 and 0 ft
- Vista Point Usable
4 lanes · works with the lake between 202 and 0 ft
- White Oak Usable
6 lanes · works with the lake between 202 and 0 ft
Ramp locations and pool ranges: U.S. Army Corps of Engineers (district GIS layers); the status is Creek & Lake's computation. Level: read Oct 26, 3:00 PM EDT.
Jordan Lake, North Carolina. Run by USACE Wilmington District.
Jordan Lake level
Daily level, past 12 months, feet above sea level (NGVD29). Shaded: the normal range, the middle half of readings for each date, 1995 to 2025. U.S. Army Corps of Engineers; 151 days from the U.S. Geological Survey.
Monthly average since Oct 2, 1995; gaps where the record is missing. U.S. Army Corps of Engineers; 11,095 days from the U.S. Geological Survey.
About Jordan Lake today
How full is Jordan Lake?72.0% full, 3.0 ft below full pool
72.0% full by storage on Oct 26. Conservation pool between the top of inactive pool (202 ft) and the top of conservation (216 ft).
Full pool is 216.00 ft.
How low is Jordan Lake?3.1 ft above its lowest since 1995
3.0 ft below full pool. The lowest daily level in our record since 1995 is 209.90 ft, on Aug 25, 2002.
Is Jordan Lake still dropping?Yes: down 0.51 ft this week
| Change | Feet | Level then |
|---|---|---|
| Past day (since Oct 25) | 0.13 down | 213.11 |
| Past 7 days (since Oct 19) | 0.51 down | 213.49 |
| Past 30 days (since Sep 26) | 1.48 down | 214.46 |
| Past year (since Oct 26, 2025) | 0.98 down | 213.96 |
Is Jordan Lake lower than normal?Yes: 2.8 ft below normal for this date
Normal for Oct 26 is 215.75 ft: the median of 217 daily readings within 3 days of this date, 1995 to 2025. Jordan Lake is 2.8 ft below it.
We haven't found an operator's statement of the reason for this lake yet, so this answer only compares the level with a normal year.
What is the water temperature at Jordan Lake?No official reading for this lake
No USGS in-lake water-temperature gauge found within the lake area (checked 2026-10-24). Stream gauges above or below the dam were not used: tailwater and inflow temperatures differ from the lake surface.
When was Jordan Lake last full?Aug 31, 2026
The last day in our record at or above 216.00 ft, today's full pool.
Jordan Lake full pool level216.00 ft
Elevations are feet above sea level (NGVD29).
Where it comes from: Guide curve 216.0 ft (USACE Wilmington District weekly water management report).
Jordan Lake this time last year214.0 ft on Oct 26, 2025
1.0 ft lower than a year ago.
Levels: U.S. Army Corps of Engineers, read Oct 26, 3:00 PM EDT. Normal and records come from Creek & Lake's stored daily history (11,310 days since 1995); they aren't official unless the operator publishes the same value.