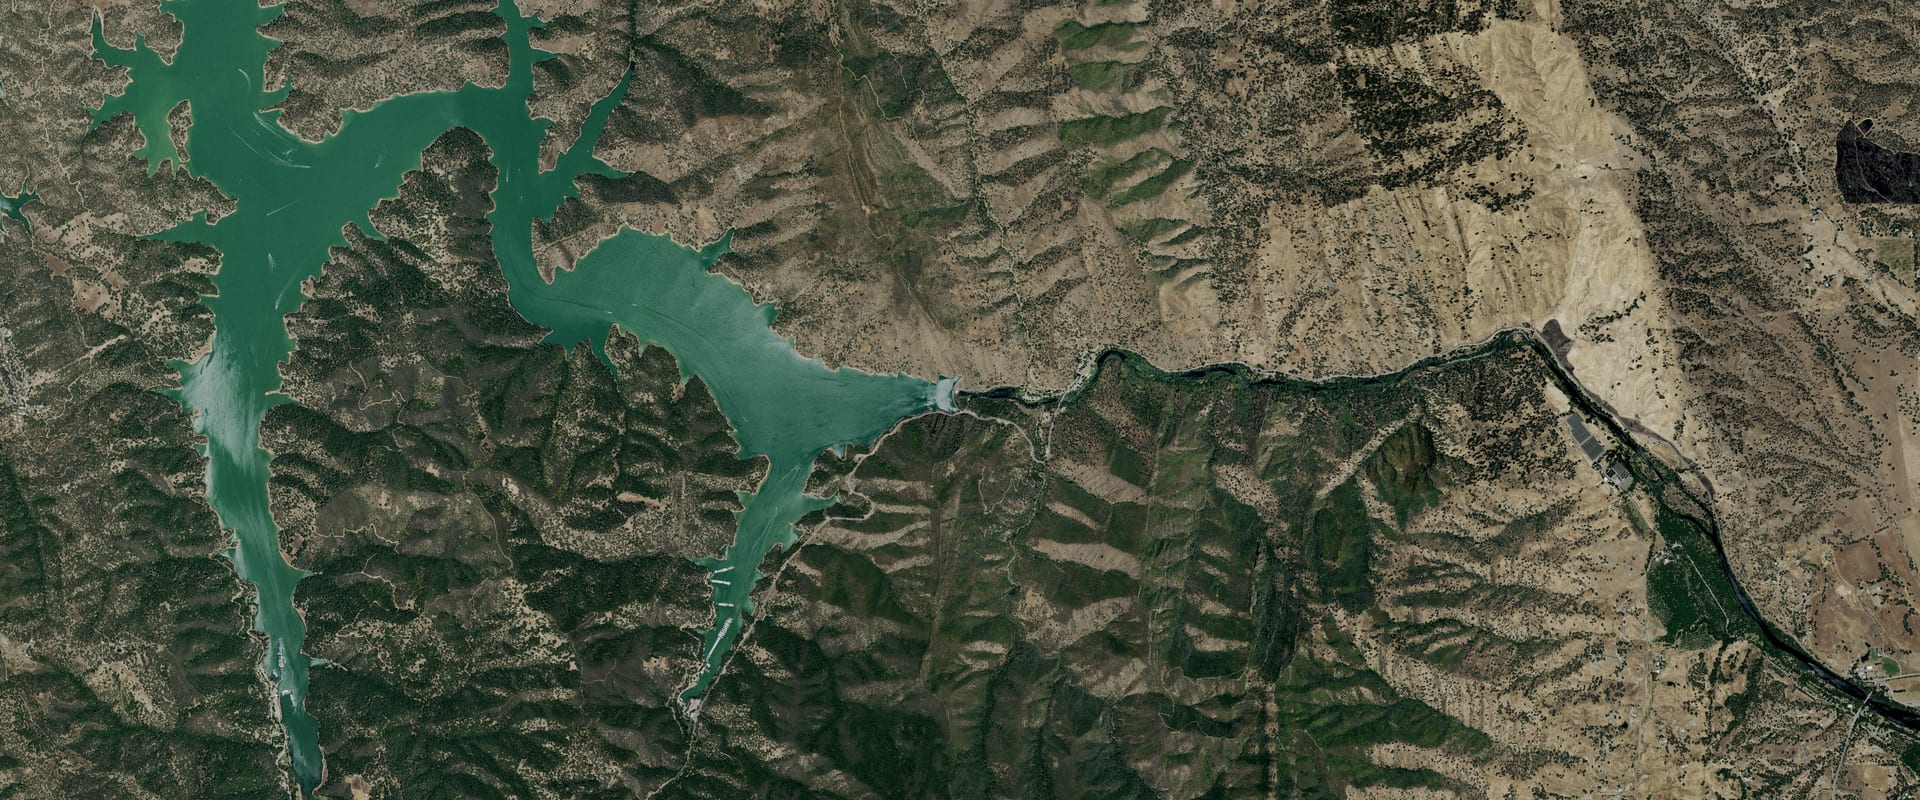
Lake Berryessa Water Level Today
12.4 ft below full pool, 82.7% full, and 1.5 ft lower than a year ago.
Daily reading for Oct 25
Trend and source week, month, year
Source: U.S. Bureau of Reclamation. Check it at cdec.water.ca.gov/dynamicapp/QueryF?s=BER
Lake Berryessa, California. Run by USBR.
Lake Berryessa level
Daily level, past 12 months, feet above sea level (NGVD29). Shaded: the normal range, the middle half of readings for each date, 1991 to 2025. U.S. Bureau of Reclamation.
Monthly average since Jul 1, 1975; gaps where the record is missing. U.S. Bureau of Reclamation.
About Lake Berryessa today
How full is Lake Berryessa?82.7% full, 12.4 ft below full pool
82.7% full by storage on Oct 25. Total storage / reservoir capacity (1,602,000 af), as CDEC reports "% of capacity".
Full pool is 440.00 ft.
How low is Lake Berryessa?65.9 ft above its lowest since 1975
12.4 ft below full pool. The lowest daily level in our record since 1975 is 361.73 ft, on Dec 1, 1992.
Is Lake Berryessa still dropping?Yes: down 0.11 ft this week
| Change | Feet | Level then |
|---|---|---|
| Past day (since Oct 24) | 0.02 down | 427.65 |
| Past 7 days (since Oct 18) | 0.11 down | 427.74 |
| Past 30 days (since Sep 25) | 1.22 down | 428.85 |
| Past year (since Oct 25, 2025) | 1.47 down | 429.10 |
Is Lake Berryessa normal for this time of year?5.8 ft above normal for this date
Normal for Oct 25 is 421.88 ft: the median of 245 daily readings within 3 days of this date, 1991 to 2025. Lake Berryessa is 5.8 ft above it.
What is the water temperature at Lake Berryessa?No official reading for this lake
No USGS in-lake water-temperature gauge found within the lake area (checked 2026-10-24). Stream gauges above or below the dam were not used: tailwater and inflow temperatures differ from the lake surface.
When was Lake Berryessa last full?Apr 28, 2025
The last day in our record at or above 440.00 ft, today's full pool.
Lake Berryessa full pool level440.00 ft
Elevations are feet above sea level (NGVD29).
Where it comes from: Glory-hole spillway crest, 440 ft (Bureau of Reclamation project page usbr.gov/projects/index.php?id=186). CDEC station BER elevation (456 ft) is the dam crest, not full pool.
Lake Berryessa this time last year429.1 ft on Oct 25, 2025
1.5 ft lower than a year ago.
Levels: U.S. Bureau of Reclamation, daily reading for Oct 25. Normal and records come from Creek & Lake's stored daily history (18,745 days since 1975); they aren't official unless the operator publishes the same value.